How to use Confusion Matrix in Scikit |
您所在的位置:网站首页 › sklearn confusion › How to use Confusion Matrix in Scikit |
How to use Confusion Matrix in Scikit
|
Share this post
The confusion matrix is often used in machine learning to compute the accuracy of a classification algorithm. 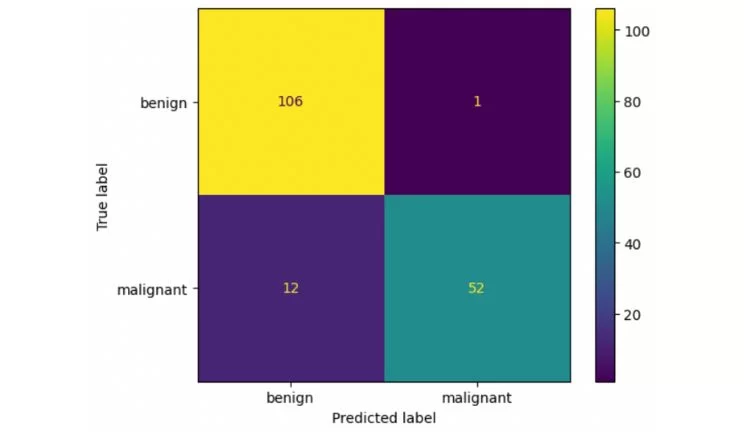
It can be used in binary classifications as well as multi-class classification problems. What the Confusion Matrix Measures?It measures the quality of predictions from a classification model by looking at how many predictions are True and how many are False. Specifically, it computes: True positives (TP)False positives (FP)True negatives (TN)False negatives (FN) Understand the Confusion MatrixHere, we will try to make sense of the true positive, true negative, false positive and false negative values mean. 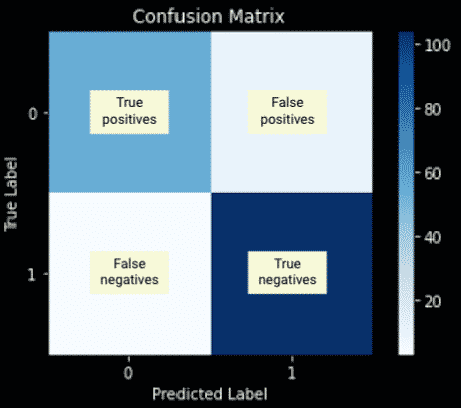 True Positive
The model predicted true and it is true. The model predicted that someone is sick and the person is sick. True NegativeThe model predicted false and it is false. The model predicted that someone is not sick and the person is not sick. False PositiveThe model predicted True and it is false. The model predicted that someone is sick and the person is not sick. False NegativeThe model predicted false and it is true. The model predicted that someone is not sick and the person is sick. How to Create a Confusion Matrix in Scikit-learn?Please enable JavaScript Modelling an SR Flip Flip as a Finite State Machine with PythonIn order to get a confusion matrix in scikit-learn: Run a classification algorithmclassifier.fit(X_train, y_train)y_pred = classifier.predict(X_test)
from sklearn.metrics import confusion_matrix
confusion_matrix(y_test, y_pred)
plot_confusion_matrix(classifier, X_test, y_test, cmap=plt.cm.Blues)plt.show()
print(classification_report(y_test, y_pred))
In a previous article, we classified breast cancers using the k-nearest neighbors algorithm from scikit-learn. I will not explain this part of the code, but you can look at the detail in the article on the k-nearest neighbors. import pandas as pd from sklearn.datasets import load_breast_cancer from sklearn.neighbors import KNeighborsClassifier from sklearn.model_selection import train_test_split def to_target(x): """Map targets to target names""" return list(dataset.target_names)[x] # Load data dataset = load_breast_cancer() df = pd.DataFrame(dataset.data,columns=dataset.feature_names) df['target'] = pd.Series(dataset.target) df['target_names'] = df['target'].apply(to_target) # Define predictor and predicted datasets X = df.drop(['target','target_names'], axis=1).values y = df['target_names'].values # split taining and test set X_train, X_test, y_train, y_test = train_test_split(X, y, test_size=0.3, random_state=42, stratify=y) # train the model knn = KNeighborsClassifier(n_neighbors=8) knn.fit(X_train, y_train) y_pred = knn.predict(X_test) # compute accuracy of the model knn.score(X_test, y_test)The result is an accuracy score of the model. 0.9239766081871345 Create a confusion matrixUse the confusion_matrix method from sklearn.metrics to compute the confusion matrix. from sklearn.metrics import confusion_matrix cm = confusion_matrix(y_test,y_pred) cmThe result is an array in which positions are the same as the quadrant we saw in the past. array([[ 57, 7], [ 5, 102]]) cm[0][0] = TPcm[1][1] = TNcm[0][1] = FPcm[1][0] = FN Plot the confusion matrixYou can use the plot_confusion_matrix method to visualize the confusion matrix. import matplotlib.pyplot as plt from sklearn.metrics import plot_confusion_matrix color = 'white' matrix = plot_confusion_matrix(knn, X_test, y_test, cmap=plt.cm.Blues) matrix.ax_.set_title('Confusion Matrix', color=color) plt.xlabel('Predicted Label', color=color) plt.ylabel('True Label', color=color) plt.gcf().axes[0].tick_params(colors=color) plt.gcf().axes[1].tick_params(colors=color) plt.show()The result is your confusion matrix plot. 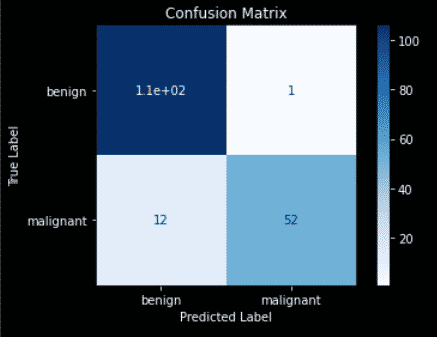 Top left quadrant = True Positives = Number of benign labelled as benignBottom right quadrant = True Negatives = Number of malignant labelled as malignantTop right quadrant = False Positives = Number of benign labelled as malignantBottom left quadrant = False Negatives = Number of malignant labelled as benign
Run the classification report
Top left quadrant = True Positives = Number of benign labelled as benignBottom right quadrant = True Negatives = Number of malignant labelled as malignantTop right quadrant = False Positives = Number of benign labelled as malignantBottom left quadrant = False Negatives = Number of malignant labelled as benign
Run the classification report
With data from the confusion matrix, you can interpret the results by looking at the classification report. from sklearn.metrics import classification_report print(classification_report(y_test, y_pred))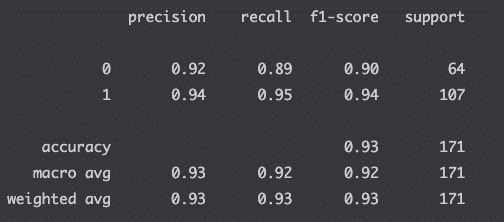
If you don’t understand the result above, make sure that you read the article that I wrote on the classification report. Definitions Confusion MatrixQuality measurement of predictionsScikit-learnMachine learning package in PythonTrue positiveModel correctly predicts the positive classFalse positiveModel incorrectly predicts the positive classTrue negativeModel correctly predicts the negative classFalse negativeModel incorrectly predicts the negative class Cheatsheet Install sklearnpip install -U scikit-learnPython library importfrom sklearn.metrics import confusion_matrixPlot confusion matrixsklearn.metrics.plot_confusion_matrixClassification reportsklearn.metrics.classification_report Confusion Matrix FAQs How do you get a confusion matrix in scikit-learn?Run a classification algorithm, import the confusion matrix function from the sklearn.metrics module, run function on test and prediction and plot the matrix. Why use confusion matrix?use the confusion matrix to evaluate the performance of a machine learning classification algorithm. Is confusion matrix better than accuracy?The confusion matrix provides more insights into a model’s performance than classification accuracy as it shows the number of correctly and incorrectly classified instances. Can confusion matrix be used on continuous values (e.g. linear regression)?Confusion matrices shows the accuracy of the prediction of classes. When trying to predict a number output like in the case of the continuous output of a regression model, confusion matrix should not be used. What is confusion matrix used for?The confusion matrix is used to evaluate the accuracy of a machine learning model that tries to predict classes (e.g. Classification). How do you create a confusion matrix in Python?Use the confusion_matrix function from the sklearn.metrics module. Is confusion matrix only for binary classification problems?No. Confusion matrix can be used for binary classification as well as multi-class classification problems. ConclusionThis article was quite big to grasp. All I want you to leave with is that it is super important to look at the confusion matrix to help you fine-tune your machine learning models. This can modify the accuracy score quite heavily in some cases. Good work on building your first confusion matrix in Scikit-learn. 3.7/5 - (12 votes) Jean-Christophe Chouinard Jean-Christophe ChouinardSEO Strategist at Tripadvisor, ex- Seek (Melbourne, Australia). Specialized in technical SEO. In a quest to programmatic SEO for large organizations through the use of Python, R and machine learning. Related posts: Classification In Machine Learning How to use Classification Report in Scikit-learn (Python) Machine Learning (ML) – Complete Guide Regression in Machine Learning ready |


【本文地址】